
 Datatific Review - Free!
Explore. Compare. Synchronize. All in One.
Datatific Review is a professional-grade data application designed to explore, compare, and synchronize data across disparate sources. Supporting Access, Excel, MySQL, Oracle, and SQL Server, it provides a unified interface for working with heterogeneous systems that normally require separate tools. Its intuitive design is paired with advanced features that allow both technical and business users to make sense of complex datasets quickly and accurately.
What Is Datatific Review
Datatific Review makes it easy to explore, compare, and synchronize data across Access, Excel, MySQL, Oracle, and SQL Server—all in one powerful, feature-rich application.
Features
-
Getting Started
Datatific Review is a versatile data application designed to explore, compare, and reconcile data across Access, Excel, MySQL, Oracle, and SQL Server. Getting started is simple—connect to your data source, browse your tables, and begin analyzing with intuitive tools for filtering, searching, and formatting. Whether you’re validating data between spreadsheets and databases, reconciling records across different systems, or preparing datasets for reporting and migration, Datatific Review provides a streamlined, user-friendly environment. With its advanced intelligent auto-mapping comparison engine, it bridges the gap between exploration and synchronization, making it ideal for tasks ranging from quick data checks to complex integration workflows.
-
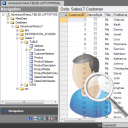
Data Explorer
Explore data from Access, Excel, MySQL, Oracle, and SQL Server through an intuitive interface packed with advanced tools. Navigate with a structured data tree, quickly filter and sort columns, or perform precise searches with regular expressions. Go beyond viewing by applying calculations and formatting, examining detailed table and column metadata, and seamlessly copying or exporting data for further use. With this rich toolkit, Datatific Review transforms raw data into an accessible, interactive experience.
-
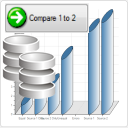
Compare and Import
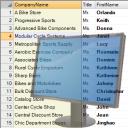
Datatific Review enables you to compare two tables or versions of data—even when they originate from different sources and database types. Its advanced AI Auto Map feature intelligently aligns columns with mismatched names or data types, eliminating the need for tedious manual mapping. Before running a comparison, you can apply column formats, build expressions, or filter data to ensure accuracy and consistency. Select one or more columns as the unique row keys.
The results are presented in a clear, color-coded view that distinguishes rows that are equal, unequal, or present in only one dataset. Unequal rows are stacked side-by-side and highlighted, making differences immediately visible. From this comparison output, you can go beyond analysis by directly importing or updating records in a target table or system. This transforms the comparison into an actionable process—streamlining data integration, synchronization, and reconciliation workflows.
-
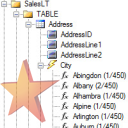
Data Navigator
The Data Navigator provides an interactive data tree that makes it easy to explore database tables, views, and metadata in a structured way. As you drill down by column and value, the tree dynamically updates, allowing you to filter and refine results step by step. Along the way, you can view column insights such as distinct values, counts, and totals, giving you a clear picture of your data content and distribution. This flexible navigation approach transforms large datasets into an intuitive exploration experience.
-
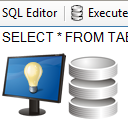
SQL Editor
The SQL Editor lets you query data and run DBMS commands for managing your databases. You can insert and update records as well as create, alter, and drop tables and views. Every query and command you run is automatically saved in a reusable list, making it easy to re-execute frequent tasks or build on prior work. Results are displayed instantly for review and can also be used in comparisons, streamlining both analysis and database management.
-
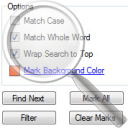
Advanced Search
Perform comprehensive searches across your data using regular expressions. You can search within a specific column or scan the entire table, with options to highlight results, filter matches, and navigate easily using Find Next. Additional controls include Match Case, Match Whole Word, and Wrap Search to Top. Regular expressions offer a concise and flexible way to define search patterns—for example,
gr[ae]ywill match both “gray” and “grey.” For more advanced pattern syntax, refer to standard online resources on regular expressions. -
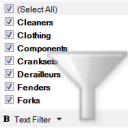
Filter and Sort
Easily refine your data in the table view using column value filters or conditional filters. To apply a filter, simply click the filter button (down arrow) in a column header and choose from the available options. Multiple filters can be combined for precise control, and with a single click on “Remove applied filter” in the ribbon, you can instantly clear them all and return to the full dataset.
-
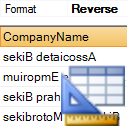
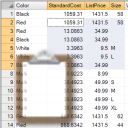
Column Formats
Column Formats let you control how data is displayed on the screen without altering the underlying source. This is especially valuable when preparing or conditioning data before comparing, analyzing, or exporting. You can apply custom formats to dates, numbers, and text to make values clearer and more consistent—for example, standardizing date patterns, adding currency symbols, or adjusting decimal precision. Formats can also improve readability and highlight important context without requiring changes to the original database or file. By tailoring how information appears, Column Formats help you present data in the most meaningful way for your workflow.
-

Expression Builder
Expressions let you create virtual, in-memory columns by applying custom formulas or logic to existing fields—allowing you to reshape or extend your data without modifying the original table or view. This gives you the flexibility to perform calculations, transform values, or generate entirely new fields that your database does not natively provide. For example, you can multiply price by quantity to calculate a total, append units of measure to a number for clarity, or concatenate multiple columns into a single formatted string. Expressions also support conditional logic, such as If…Then…Else statements, enabling you to return values based on Boolean expressions. Whether you need to enrich your data for reporting, standardize formats for comparison, or derive new business metrics, Expressions provide a powerful way to customize your dataset in real time—without altering the source.
-
Copy Data
The Copy Data feature gives you full control over how information is moved from the application into other tools. You can copy rows, columns, or any selected range of cells with precision. Four copy modes are available to match your needs: data only, with row headers, with column headers, or with both row and column headers. Hidden rows and columns are automatically excluded, ensuring only visible content is copied. In addition, tree data can be copied directly to the clipboard, preserving its hierarchical structure. This flexibility makes it simple to transfer clean, well-structured data into spreadsheets, documents, or other applications for reporting, analysis, or sharing.
-
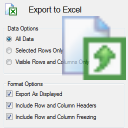
Export Data
The Export Data feature lets you easily save the contents of the table panel for use outside the application. Data can be exported in multiple formats, including Excel (XLS and XLSX), Text (TXT/CSV), and XML, providing maximum flexibility for analysis, reporting, sharing, or integration with other systems. A comprehensive set of data and formatting options allows you to customize how information is written—whether you need clean raw data, properly labeled outputs, or formatted tables—ensuring your exported files are tailored to match your reporting, documentation, or migration requirements.
-
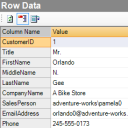
Row Data
The Row Data feature makes it easier to examine records in detail by transposing horizontal row data into a vertical list. Instead of scrolling across wide tables, you can view all column values neatly stacked in a single column format, improving readability and reducing context switching. As you navigate through the table panel, the Row Data view updates automatically to reflect the current row, ensuring you always see the most relevant record. To further simplify review, blank values can be hidden, allowing you to focus only on the fields that contain meaningful information. This feature is especially useful when working with wide datasets, performing record-by-record verification, or preparing data for audits and quality checks.
-
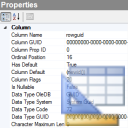
Column Metadata
The Column Metadata feature provides detailed insights into each column’s properties, including data type, size, and position within the table. In addition, it displays table view column properties, some of which can be customized, such as caption, font type, font size, and format. As you navigate from one column to another in the table view, the metadata panel updates instantly, giving you a precise and dynamic reference point. This makes it easy to understand the structure of your data, adjust presentation settings for readability, and ensure consistency across reports or exports.
-
Custom Display
The Custom Display feature lets you tailor how data is presented to match your workflow. You can reorder or hide columns, freeze columns for easier navigation, and resize rows and columns for clarity. These layout preferences are automatically saved (with the exception of row sizes) and restored the next time you open the table, ensuring a consistent viewing experience. Layouts also preserve column formats and property settings, allowing you to maintain both the look and feel of your data across sessions.
-
Options
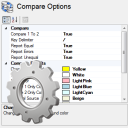
The Options feature gives you full control over how Datatific Review looks, feels, and behaves. You can personalize the application with different color themes to suit your preference, and define default table settings such as column layouts and display preferences. The Data Explorer can be tailored with a default look and feel that matches your workflow, making it easier to browse and navigate data. For comparisons, you can set default behaviors that control how data is aligned, filtered, and displayed, as well as customize the background and font colors used in compare results for maximum readability. With these flexible options, the application adapts to you—ensuring a consistent and personalized experience every time you work with your data.
Who will benefit from Datatific Review?
Datatific Review is designed for professionals who need to integrate, reconcile, and validate data across systems that don’t naturally align.
-
Data Integration Teams & ETL Developers
Automap and reconcile datasets between different database systems with minimal manual mapping.
-
Data Analysts & BI Specialists
Explore, filter, and prepare data from multiple environments, using advanced search, formatting, and expression tools.
-
Database Administrators & Engineers
Manage schema changes, run SQL commands, and synchronize data across heterogeneous platforms.
-
Business Users
Compare spreadsheet versions, align external datasets, and generate reconciled reports without needing deep technical knowledge.
In every case, Datatific Review reduces the time and effort required to compare, understand, and act on data—transforming tedious, error-prone reconciliation into a streamlined, visual, and intelligent process.
And the best part? It’s free for personal use.
Free! Install from Windows
Store
Install Datatific Review today and get started with managing your data effectively!
Important Notice
By downloading and using Datatific Review, you agree to our End User License Agreement (EULA).